Sometimes you have to take a moment to breathe in and breathe out and enjoy the fact that you have achieved something you where once dreaming of.
There are a lot of ‘Top/Best.. lists’ in our industry. You can actually buy your way into some of them. Shocking, right?
You can’t buy your way into the AppsFlyer Performance Index. The AppsFlyer Performance Index offers app marketers the most comprehensive report card on the performance of mobile media sources. You need to earn your spot there. It is based on hard data. They have analyzed 14.5 billion installs and 25 billion app opens of over 8,000 apps.
So, what did they measure?
- 250,000 Media Agencies, with a minimum of 50,000 attributed installs.
- 8,200 apps with a minimum of 2,000 non-organic installs.
I hear you thinking, what about the f-word (fraud)?
Fraud unfortunately is a thing in our industry and it’s intensifying. This is especially true for non-gaming apps with a four times higher rate of fraud than gaming.’ (AppsFlyer Performance Index, 2018). Fraud in non-gaming apps is due to the relative lack of sophistication among non-gaming app marketers and higher payouts, which are pushing bad actors to target non-gaming apps more often than gaming ones. Fear not, the results are controlled for fraud.
How did they measure it?
They used two ranking methods:
Volume Ranking: A ranking of media sources based mostly on the total number of non fraudulent installs each was attributed for, in addition to the number of apps running with a specific source in a given region/category
Power Ranking: Volume & Retention Combined: a normalized and combined number of non-fraudulent installs and the weighted retention score of each media source. Factored with an additional fraud penalty based on the agency’s overall fraud rate for the region in question.
You can check the entire methodology AppsFlyer used here.
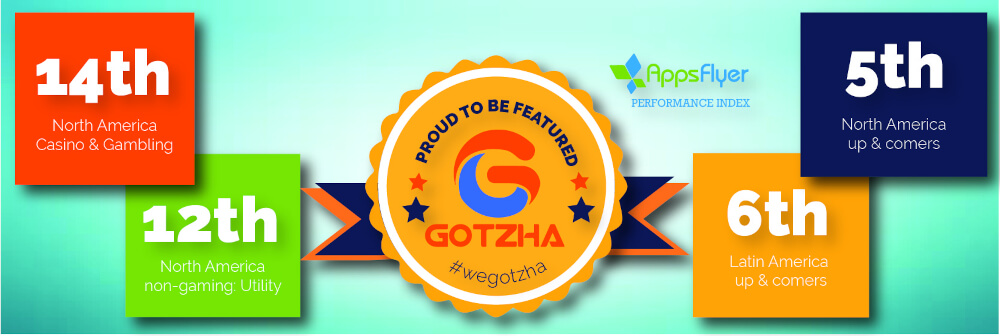
We are featured in the Power Ranking lists on the following positions:
- North America Casino & Gambling: 14th place
- North America/non-gaming: Utility: 12th place
- North America/up & comers: 5th place
- Latin America up & comers: 6th place

These listings are a confirmation for us; we’re getting bigger and better in the app market.
Would you like to run gaming or non-gaming app offers? Sign up as Publisher.
